
Data Pre-processing is the first and crucial step in Machine Learning. Unfortunately, it is the most ignorant one. Feature scaling is one of the data pre-processing tasks. Let’s understand feature scaling and its methods.
Table of Contents
- Define Feature Scaling
- Why is Feature Scaling necessary?
- Various Feature Scaling Methods
- Implementation
- The Crucial Question – Normalization or Standardization?
- Key Takeaways
Define Feature Scaling
Feature scaling brings features(independent variables) on the same scale. All features of a dataset are not necessarily always on the same scale, they vary highly in magnitude, units, and range. For the Machine Learning model to perform well, all features need to be on the same scale. It is the crucial step for data preparation before modeling.
Why is Feature Scaling necessary?
Every data scientist must have come across a dataset with independent variables in different magnitudes or units or ranges like one variable in Km, one in meters, one in grams, one in liters, etc. Feature Scaling is important for such datasets as it improves the machine learning model’s performance.
Distance-Based Algorithm
As we all know, many algorithms like KNN, KVM, and K-means use Euclidean distance between two data points for their functioning. Therefore, if features are on a different scale, then features with higher magnitude will be given higher weightage. Naturally, this will impact the machine learning algorithm’s performance, and obviously, we do not want our algorithm to be biased towards one feature.
Feature Scaling works very well for distance-based algorithms.
In distance-based algorithms, there is a chance that higher weightage is given to features with higher magnitudes. Naturally, this will impact the machine learning algorithm’s performance, and obviously, we do not want our algorithm to be biased towards one feature, so scaling is necessary.
Tree-Based Algorithm
There are many tree-based algorithms like decision trees and random forests, on which feature scaling only has a small effect. This is because in a tree-based algorithm, a node is split based on a single feature, and other features do not influence this split on a feature.
Implementing feature scaling for tree-based algorithms is not necessary.
Various Feature Scaling Methods
Two feature scaling methods are widely used: Normalization and Standardization. Let’s learn them in detail.
Normalization
Normalization is also called Min-Max Normalization or Min-Max scaling. Normalization rescales the features and brings the feature with a distribution value between 0 and 1.
Formula for Normalization
Let’s take a feature ‘a’ with values: a1,a2,a3,a4………..an
Maximum value = amax
Minimum value = amin
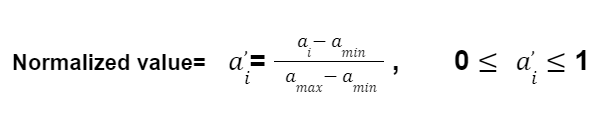
Here amax and amin are the minimum and maximum values of the feature vector ‘a’, respectively.
For data in 2-D, we have two features. After normalization, all data will be in a unit square.
For data in space, normalization brings it in a unit-hyper cube.
Standardization

Standardization rescales the feature values such that it has a distribution with 0 mean value and variance equal to 1.
Formula for Standardization
Let’s take a feature ‘a’ with values: a1,a2,a3,a4………..an
Mean value =![]()
Standard deviation = σ
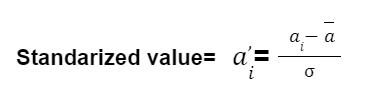
Here, ![]() is the average or mean of the feature vector ‘a’ and σ is the standard deviation of the feature vector ‘a’. After standardization, around 67% of the distribution value lies between 1 and -1 with a mean of ‘0’ and a standard deviation of ‘1’.
is the average or mean of the feature vector ‘a’ and σ is the standard deviation of the feature vector ‘a’. After standardization, around 67% of the distribution value lies between 1 and -1 with a mean of ‘0’ and a standard deviation of ‘1’.
Standardization brings data around zero mean.
Implementation
Let’s implement Normalization and Standardization on the two features of the Iris dataset and visualize the results.
Step 1:
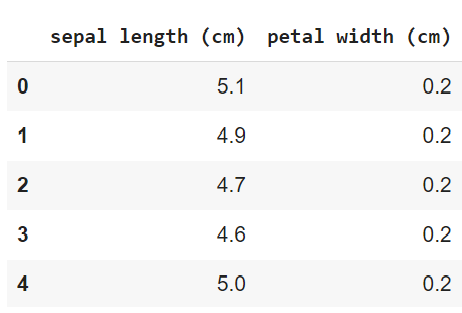
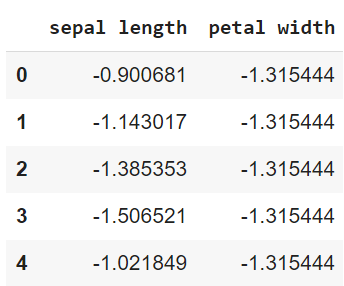
We are loading the Iris dataset and selecting its two features ‘sepal length (cm)’, and ‘petal width (cm)’ for further analysis.
| Python Code: import pandas as pd import numpy as np import seaborn as sns import matplotlib.pyplot as plt iris_data = pd.DataFrame(datasets.load_iris().data, columns=datasets.load_iris().feature_names) df=iris_data[[‘sepal length (cm)’, ‘petal width (cm)’]] df.head() Output:
|
Step 2:
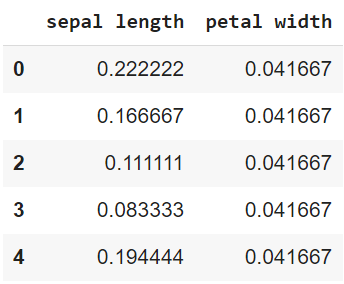
Use MinMaxScaler from sklearn preprocessing to normalize the features of the dataset. All values will lie between ‘0’ and ‘1’.
| Python Code: from sklearn import preprocessing min_max_scaler = preprocessing.MinMaxScaler(feature_range =(0, 1)) df_normal= pd.DataFrame(min_max_scaler.fit_transform(df)) #feature normalization df_normal.columns =[‘sepal length’, ‘petal width’] df_normal.head() Output: |
Step 3:
Use StandardScaler from sklearn preprocessing to normalize the features of the dataset. The mean of all standardized values will be zero and the variance will be ‘1’.
| Python Code: Standardization = preprocessing.StandardScaler() df_standard= pd.DataFrame(Standardization.fit_transform(df)) # Standard scaled features df_standard.columns =[‘sepal length’, ‘petal width’] df_standard.head() Output:
|
Step 4:
Let’s plot kernel density plot to see the distribution difference between original, normalized, and standardized values.
| Python Code: fig, (ax1, ax2, ax3) = plt.subplots(ncols=3, figsize=(10, 5)) # before scaling ax1.set_title(‘Before Scaling’) sns.kdeplot(df, ax=ax1) # after normalization ax2.set_title(‘After Normalization’) sns.kdeplot(df_normal, ax=ax2) # after Standardization ax3.set_title(‘After Standardization’) sns.kdeplot(df_standard, ax=ax3) plt.show() Output:
|
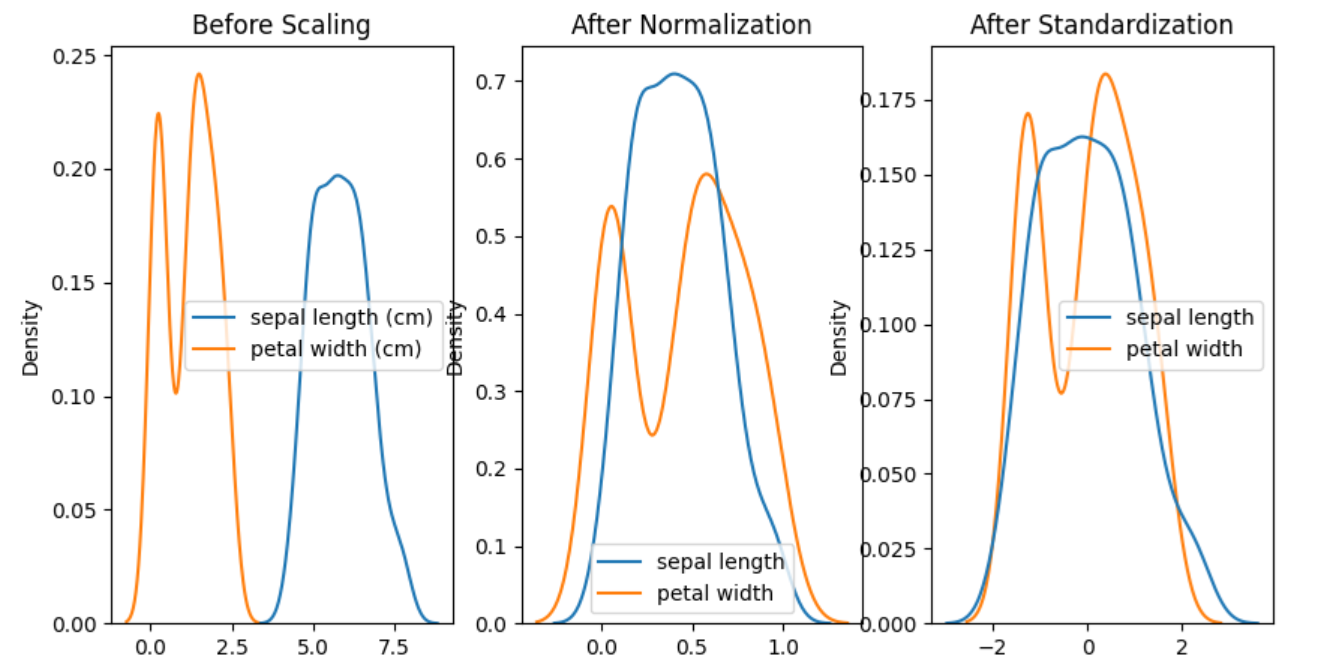
From the above plot, the difference between the three can be visible. Key learning are:
- Before scaling, values of sepal length and petal width are different.
- After Normalization, values of both features lie between 0 and 1.
- After standardization, the mean of both features changes to 0.
- All data values become close to each other under fixed dimensions in both scaling methods.
The Crucial Question – Normalization or Standardization?
There is no correct answer to this question: Normalization or Standardization which should be preferred?
Conditions for Normalization to be preferred
Below are some conditions when normalization is preferred:
- Data distribution does not follow Gaussian distribution (or Normal distribution).
- When data needs to be fit in a specific range only.
- In Image processing, where pixels are normalized to fit from 0 to 255 for the RGB color range.
- When the original shape of data distribution needs to be preserved.
Conditions for Standardization to be preferred:
- Data distribution follows Gaussian distribution (or Normal distribution).
- Outliers in data do not affect standardization.
- Standardization is preferred while performing Principal Component Analysis(PCA) or Clustering.
- Deep Learning Algorithms prefer standardization.
Key Takeaways
We have learned that feature scaling is a crucial data preprocessing step to scale the range of data features(independent variables). For distance-based algorithms, feature scaling is required when features’ scales are not aligned. Standardization and normalization are two main methods for applying feature scaling in machine learning, depending on the requirements and the dataset.
Implement the example Python code of normalization and standardization on various datasets to have hands-on experience.
Stay Tuned!!
Learn the basics of Data Science with our Data Science with Python series.
Keep learning and keep implementing!!


Good presentation
Clear and concise explanation had simplified the complex topic
Each detail is explained very nicely!!