
In this tutorial, we will cover subunit 3.2 Classification Metrics: Confusion Matrix, Precision, Recall, F1 of Unit 3: Evaluating Models of the AI-417 course for Class 10.
For Part 1 of this unit: Model Evaluation, Train-Test Split, Accuracy & Error, click on the link below:
3.1 Evaluating Models: Model Evaluation, Train-Test Split, Accuracy & Error (AI Course; Class 10)
In Part 1, we learned how to split the data and how to calculate accuracy and error for a model. But, we need different metrics other than accuracy and error for model evaluation which we are going to discuss in this article.
The Problem With Accuracy Alone
Imagine testing a model on 1000 patients, where 900 actually have a disease and only 100 don’t, a highly unbalanced dataset. Now imagine a lazy, faulty model that predicts “Yes, has the disease” for absolutely everyone, no matter the input.
- It correctly predicts all 900 actual “Yes” cases.
- It incorrectly predicts “Yes” for the 100 people who don’t have the disease.
Classification Accuracy = Correct Predictions ÷ Total Predictions = (900 + 0) ÷ 1000 = 90%.
Ninety percent accuracy, from a model that never actually diagnoses anything. This is exactly why, for unbalanced datasets, accuracy alone is not enough. We need better tools like Confusion Matrix, Precision, Recall, and F1 Score.
What Is a Confusion Matrix?
A confusion matrix is a handy presentation of the accuracy of a model with two or more classes as shown below. It places actual values on one axis and predicted values on the other axis. Each cell in the matrix holds the number of predictions that fall into that particular category.
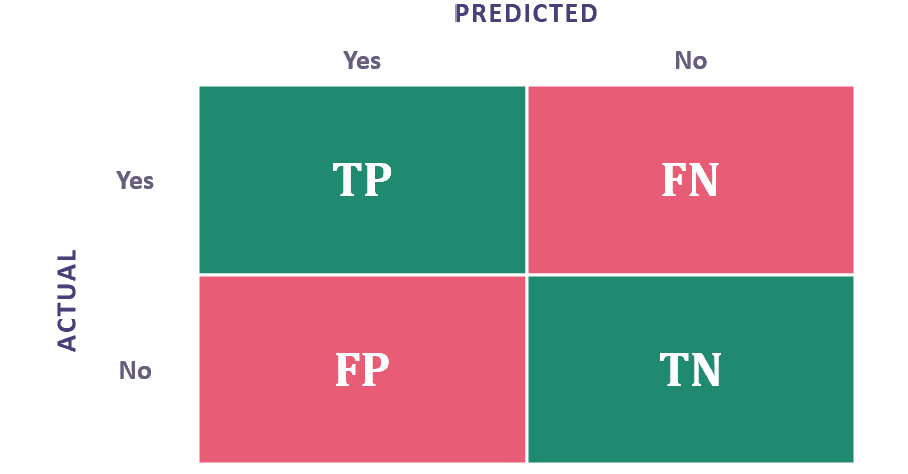
Let’s use a disease-prediction classifier as our running example, where output ‘1’ means “infected” and output ‘0’ means “not infected.”
Building a Confusion Matrix: Worked Example
Suppose we tested a model on 10 people, table shown on right hand side of below image. We recorded both their actual and predicted results.
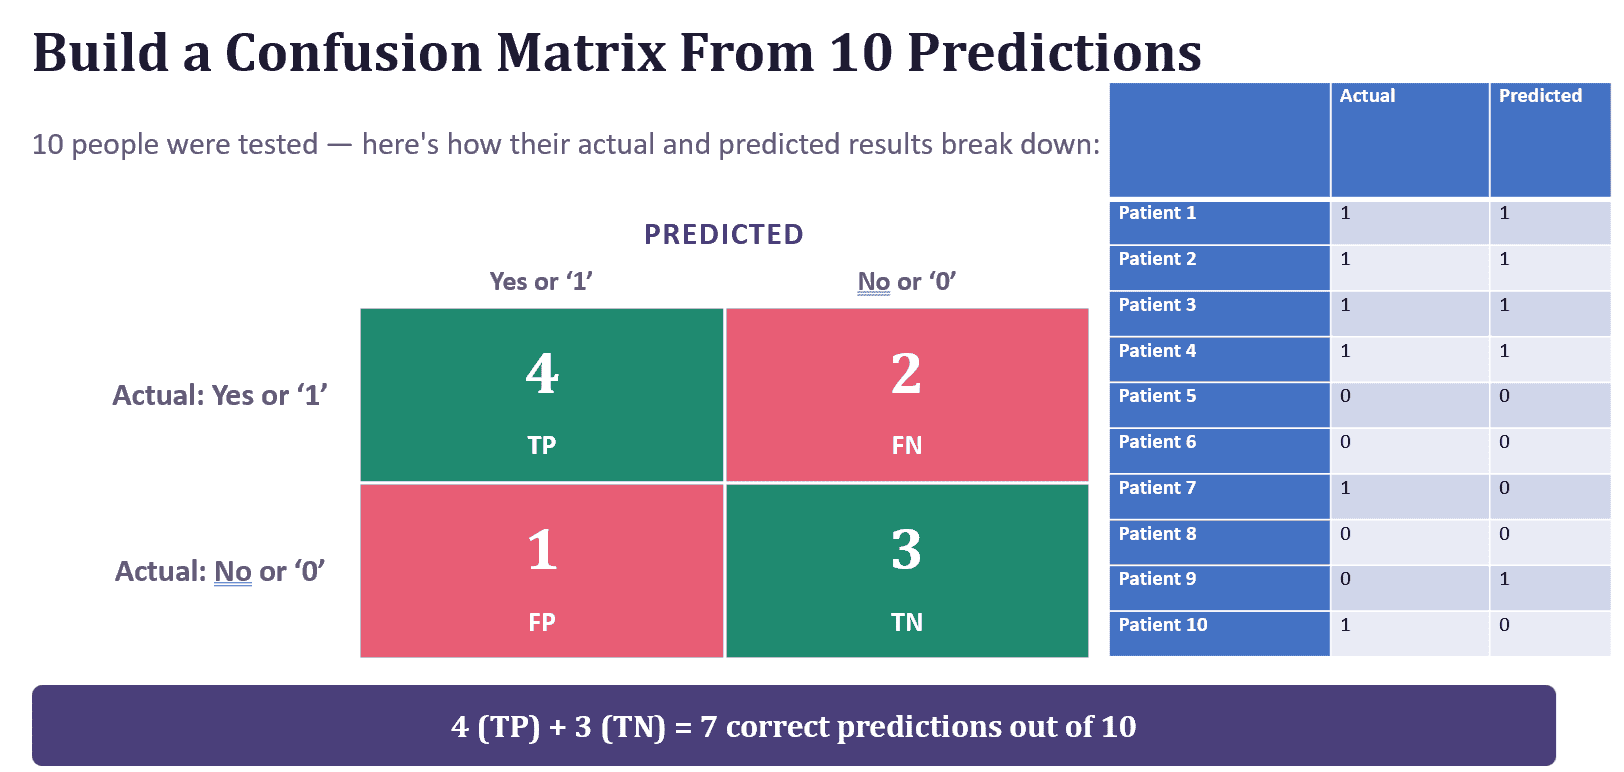
Counting the matches and mismatches gives us: 4 + 3 = 7 correct predictions out of 10.
The Four Cells of a Confusion Matrix
Let’s understand four cells of a confusion matrix in detail:
- True Positive (TP): The model correctly predicts the positive class. Example: you predicted France would win the World Cup, and it won. Or: we predicted “Yes, has the disease,” and they do have it.
- True Negative (TN): The model correctly predicts the negative class. Example: you predicted Germany would NOT win, and it lost. Or: we predicted “No disease,” and they don’t have it.
- False Positive (FP): The model wrongly predicts the negative class as positive. Example: you predicted Germany would win, but it lost. Or: we predicted “Yes, has the disease,” but they don’t.
- False Negative (FN): The model wrongly predicts the positive class as negative. Example: you predicted France would NOT win, but it won. Or: we predicted “No disease,” but they actually have it.
Classification Accuracy From the Confusion Matrix
Classification Accuracy = (TP + TN) ÷ (TP + TN + FP + FN)
For our faulty disease-prediction model: TP = 900, TN = 0, FP = 100, FN = 0.
Accuracy = (900 + 0) ÷ 1000 = 90%, but as we’ve seen, that number is misleading. Accuracy is only a reliable metric when the dataset is balanced (equal observations in each class) but in the real world it rarely happened.
Precision
Precision = TP ÷ (TP + FP) = 4 ÷ (4 + 1) = 0.8
Precision is the ratio of correctly classified positive examples to the total number of predicted positives. A precision of 0.8 means: whenever the model predicts “positive,” it is correct about 80% of the time.
When to use it?
Precision matters most when “False Positives” are the costly mistake, and the model needs to minimize them.
Example: Launching a Satellite
Suppose a day with favorable weather is the positive class, and unfavorable weather is the negative class. Missing a good-weather day (low recall) is a minor inconvenience, but predicting a bad-weather day as good (a false positive) to launch a satellite could be disastrous. Here, false positives need to be reduced as much as possible, so precision is the go-to metric.
Recall
Recall = TP ÷ (TP + FN)= 4 ÷ (4 + 2) = 0.66
Recall measures how well the model correctly identifies actual positives. A recall of 0.66 means, out of everyone who actually has the condition, 66% were correctly identified. Recall is also known as “Sensitivity” or the “True Positive Rate.”
When to use it?
Recall matters most when “False Negatives” are the costly mistake, and the model needs to minimize them.
Example: COVID-19 Detection
If an infected person is wrongly predicted as “not infected” (a false negative), they might not seek treatment and could unknowingly infect others. Here, false negatives need to be reduced as much as possible, so recall is the go-to metric.
F1 Score
Sometimes a dataset is unbalanced and we can’t clearly decide whether false positives or false negatives matter more. In those cases, the F1 Score provides a single measure that captures both precision and recall.
F1 Score = (2 × Precision × Recall) ÷ (Precision + Recall)
Try It Yourself
For each of the following, decide whether Precision or Recall matters more, and why:
- Email spam detection: Precision (don’t want real emails wrongly blocked).
- Cancer diagnosis: Recall (don’t want to miss an actual case)
- Legal cases (“innocent until proven guilty”): Precision (don’t want to falsely convict an innocent person)
- Fraud detection: Recall (don’t want fraud to slip through undetected).
- Safe content filtering (e.g., Kids YouTube): Recall (don’t want unsafe content to slip past the filter).
Test Yourself
- Why can a model with 90% accuracy still be a poor classifier?
- Define True Positive, True Negative, False Positive, and False Negative in your own words.
- Write the formula for Precision and for Recall.
- In a spam detection system, why would we prioritize Precision over Recall?
- When should we use the F1 Score instead of Precision or Recall alone?
- Think of a real-world AI system you use often (a recommendation engine, a spam filter, a search engine). Would you want it to prioritize precision or recall? Why?
- Can a model have high precision but low recall (or vice versa)? What would that look like in practice?
Stay Tuned!!
Stay tuned for next chapter, where we give live demo for No-Code AI Tools like Teachable Machine and Orange Data Mining Tool.
Click below for the YouTube video for Part 2 of Unit 3:
For any queries and clarification, kindly email us at datasciencehorizon@gmail.com
Keep learning and keep implementing!!

