
Customer Churn refers to the loss of existing customers or subscribers who fail to come back for any reason during a designated period. Businesses measure churn rate as the percentage of the number of customers lost to the total number of customers over a given time. In this article, we are going to predict customer churn in the banking sector using Machine Learning Algorithms.
Introduction
Customer Churn prediction in the banking sector is important to know whether a bank customer is going to keep their account with the bank or close it. On-time prediction using Machine Learning algorithms helps the bank in the following ways:
- By knowing that a customer is going to churn, the bank can try to retain that customer.
- Churning rate helps banks identify reasons for customers leaving
- Banks can work on their shortcoming so that they can retain old customers as well as attract new customers.
Overall, predicting customer churn is important for a bank because it can help the bank retain valuable customers and improve its overall profitability.
Data Source
The Data Source for Bank Customer Churn Prediction is taken from Kaggle. Click here for the dataset.
In the data source, we have three CSV files:
train.csv – the training dataset; ‘Exited’ is the binary target.
test.csv – the test dataset; your objective is to predict the probability of ‘Exited’.
sample_submission.csv – a sample submission file in the correct format.
Objective
The objective of this notebook is to predict whether a customer continues with their account in the bank or closes it. In training data, “Exited’ is a binary target; if its value is ‘1’, it means the customer churns, and if its value is ‘0’, it means the customer stays with the bank. The goal is to predict the probability of the target variable ‘Excited’ for test data and submit it in ‘sample_submission.csv’ format.
Evaluation Metrics
Submissions are evaluated on the area under the ROC curve between the predicted probability and the observed target.
Data Understanding
Let’s understand the dataset in detail with Python Code.
Import Libraries
Import relevant libraries.
Code to import libraries
| import pandas as pd import numpy as np import matplotlib.pyplot as plt import seaborn as sns import plotly.express as px import category_encoders as ce from sklearn.model_selection import train_test_split from sklearn.metrics import confusion_matrix from sklearn import metrics from sklearn.metrics import roc_curve, auc from sklearn.ensemble import RandomForestClassifier from sklearn.model_selection import GridSearchCV from sklearn.feature_extraction.text import TfidfVectorizer from sklearn.decomposition import TruncatedSVD import xgboost as xgb from catboost import CatBoostClassifier |
Loading Data
Load train, test, and sample_submission CSV files.
Code to load data
| train_data=pd.read_csv(“/kaggle/input/playground-series-s4e1/train.csv”) test_data=pd.read_csv(“/kaggle/input/playground-series-s4e1/test.csv”) sample_sub=pd.read_csv(“/kaggle/input/playground-series-s4e1/sample_submission.csv”) print(“Shape of train data “, train_data.shape) print(“Print columns name”, train_data.columns.values) |
Output
| Shape of train data (165034, 14) Print columns name [‘id’ ‘CustomerId’ ‘Surname’ ‘CreditScore’ ‘Geography’ ‘Gender’ ‘Age’ ‘Tenure’ ‘Balance’ ‘NumOfProducts’ ‘HasCrCard’ ‘IsActiveMember’ ‘EstimatedSalary’ ‘Exited’] |
Data Description
Training data has 165034 rows of data with 14 columns, out of which 13 are independent features and ‘Excited is a dependent feature or target variable.
id: Denotes serial no.
CustomerId: contains random values.
Surname: the surname of a customer.
CreditScore: since a customer with a higher credit score is less likely to leave the bank
Geography: a customer’s location
Gender: The gender of the customer
Age: age of customer
Tenure (years): refers to the number of years that the customer has been a client of the bank.
Balance: shows the balance in the account of the customer
NumOfProducts: refers to the number of products that a customer has purchased through the bank.
HasCrCard: denotes whether or not a customer has a credit card.
IsActiveMember: whether the customer is active or not
EstimatedSalary: denotes the estimated salary of the customer
Exited: denotes whether or not the customer left the bank. It is the target variable.
Data Cleansing
Perform data cleansing by checking all columns for their data types and checking for missing and duplicate values.
Code to get train data info
| train_data.info() |
Output
| <class ‘pandas.core.frame.DataFrame‘> RangeIndex: 165034 entries, 0 to 165033 Data columns (total 14 columns): # Column Non-Null Count Dtype — —— ————– —– 0 id 165034 non-null int64 1 CustomerId 165034 non-null int64 2 Surname 165034 non-null object 3 CreditScore 165034 non-null int64 4 Geography 165034 non-null object 5 Gender 165034 non-null object 6 Age 165034 non-null float64 7 Tenure 165034 non-null int64 8 Balance 165034 non-null float64 9 NumOfProducts 165034 non-null int64 10 HasCrCard 165034 non-null float64 11 IsActiveMember 165034 non-null float64 12 EstimatedSalary 165034 non-null float64 13 Exited 165034 non-null int64 dtypes: float64(5), int64(6), object(3) memory usage: 17.6+ MB |
Observation
There seems to be no missing value in the dataset. The data type of features with a textual value is ‘object’. Some features are of the ‘int 64’ type and some are of the ‘float64’ type. Changing the data type of ‘Age’, ‘HasCrCard’, and IsActiveMember’ from ‘float64’ to ‘int64’, as float values for them do not make any sense.
Code to change data types
| train_data[‘Age’] = train_data[‘Age’].astype(int) train_data[‘HasCrCard’] = train_data[‘HasCrCard’].astype(int) train_data[‘IsActiveMember’] = train_data[‘IsActiveMember’].astype(int) train_data.info() |
Output
| <class ‘pandas.core.frame.DataFrame‘> RangeIndex: 165034 entries, 0 to 165033 Data columns (total 14 columns): # Column Non-Null Count Dtype — —— ————– —– 0 id 165034 non-null int64 1 CustomerId 165034 non-null int64 2 Surname 165034 non-null object 3 CreditScore 165034 non-null int64 4 Geography 165034 non-null object 5 Gender 165034 non-null object 6 Age 165034 non-null int64 7 Tenure 165034 non-null int64 8 Balance 165034 non-null float64 9 NumOfProducts 165034 non-null int64 10 HasCrCard 165034 non-null int64 11 IsActiveMember 165034 non-null int64 12 EstimatedSalary 165034 non-null float64 13 Exited 165034 non-null int64 dtypes: float64(2), int64(9), object(3) memory usage: 17.6+ MB |
Similarly, change data types for the test data set as well.
Code to check for duplicate values
| train_data.duplicated().sum() |
Output
| 0 |
Observation
No duplicate values.
Exploratory Data Analysis and Visualizations
Now is the time for data exploratory analysis and visualizations. Let’s start with Univariate analysis to find statistical features like the mean, median, standard deviation, percentile, quantile, and skewness of numerical features.
Code for Univariate Analysis
| train_data.describe() #It will do univariate analysis on numerical features only |
Output
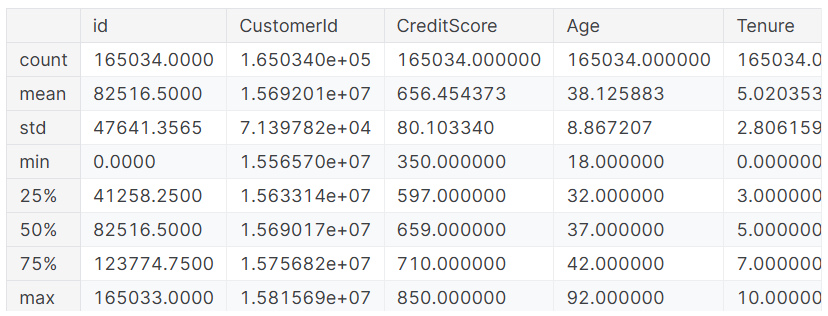 |
Observation
- ‘Id’ and ‘CustomerId’ have no significance, so we can drop them.
- ‘CreditScore’, ‘Age’, ‘Balance’, and ‘EstimatedSalary’ are features with numerical values.
- ‘Balance’ is highly left-skewed.
- ‘Age’ is slightly right-skewed. The average age of a customer is 38 years.
- Over 75% of customers have a credit card.
- The average salary of customers is above 1 lakh per annum.
Code to find out categorical features
| train_data.nunique() |
Output
| id 165034 CustomerId 23221 Surname 2797 CreditScore 457 Geography 3 Gender 2 Age 69 Tenure 11 Balance 30075 NumOfProducts 4 HasCrCard 2 IsActiveMember 2 EstimatedSalary 55298 Exited 2 dtype: int64 |
Observation
- Features ‘Geography’, ‘Gender’, ‘Tenure’, ‘NumofProducts’, ‘HasCrCard’, ‘IsActiveMember’, and ‘Excited’ are categorical features.
- However, these features can either have textual or numerical nominal values, ordinal values, or binary values. Let’s find out.
- ‘Gender’ and ‘Geography’ are textual categorical variables.
- ‘Surname’ is a textual data variable.
Code to find unique categorical values
| def find_unique(feature): #define a function to find unique values print(“Unique features of “+ feature + “: “,train_data[feature].unique()) for column in train_data[[‘NumOfProducts’,‘Tenure’,‘Gender’,‘Geography’,‘IsActiveMember’,‘HasCrCard’,‘Exited’]]: find_unique(column) |
Output
| Unique features of NumOfProducts: [2 1 3 4] Unique features of Tenure: [ 3 1 10 2 5 4 8 6 9 7 0] Unique features of Gender: [‘Male’ ‘Female’] Unique features of Geography: [‘France’ ‘Spain’ ‘Germany’] Unique features of IsActiveMember: [0 1] Unique features of HasCrCard: [1 0] Unique features of Exited: [0 1] |
Observation
- ‘NumOfProducts’ has four unique numerical values. No ordinal.
- ‘Tenure’ has 11 unique numerical values.
- ‘Gender’ has two nominal textual values.
- ‘Geography’ has three nominal textual values.
- ‘IsActiveMember’ has two binary values.
- ‘HasCrCard’ has two binary values.
- ‘Exited’ has two binary values.
Code to draw ‘Exited’ histogram
Let’s draw a histogram to understand the division of the target variable ‘Exited’.
| fig = px.histogram(train_data, x=‘Exited’,text_auto=True, title=‘Churn Distribution’) fig.show() |
Output
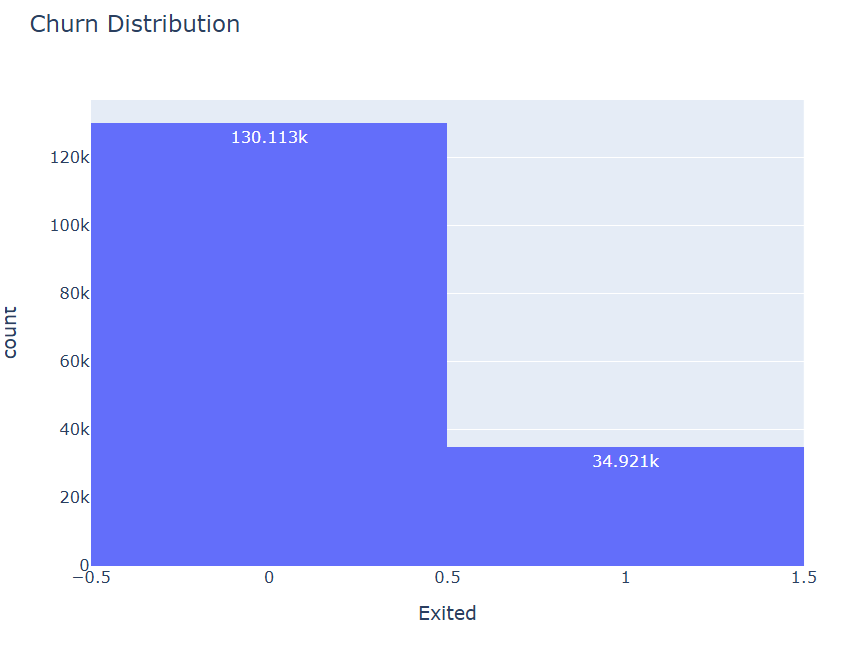 |
Observation
34921 customers are coming back, but 130113 are not out of 165034
Kaggle Notebook
To learn further about data visualization, feature engineering, various machine learning algorithm implementations, and final results, kindly go to the Kaggle notebook.
https://www.kaggle.com/code/playingmyway/bank-churn-data-prediction
Stay Tuned!!
Learn learn to predict an introvert from an extrovert on a Kaggle dataset in detail by clicking on the link below:
Keep learning and keep implementing!!


Good article
Very informative.
Thanks dear.